“Fertility Rate Stabilizes as the Economy Grows” — read the NY Times headline last month, over its report on the on the CDC preliminary report on births in 2012. They went to explain both that “an improving economy encouraged Americans to resume having babies” and that “[t]he number of babies born in the United States in 2012 remained flat.”
The first statement is partially true – the group of people who “resumed having babies” is women 30 and over, while women 29 and under were still having fewer than ever. The second statement is pretty much true – the rate declined only marginally. The 2012 rate is nevertheless the lowest ever recorded in the US, coming in at 63.0 births / 1000 women aged 15-44, as opposed to the earlier all-time low, 63.2 in 2011.
Here’s a visual to give a sense of how the overall decline continues at the lower end of the age span, and has swung up a bit at the far end:
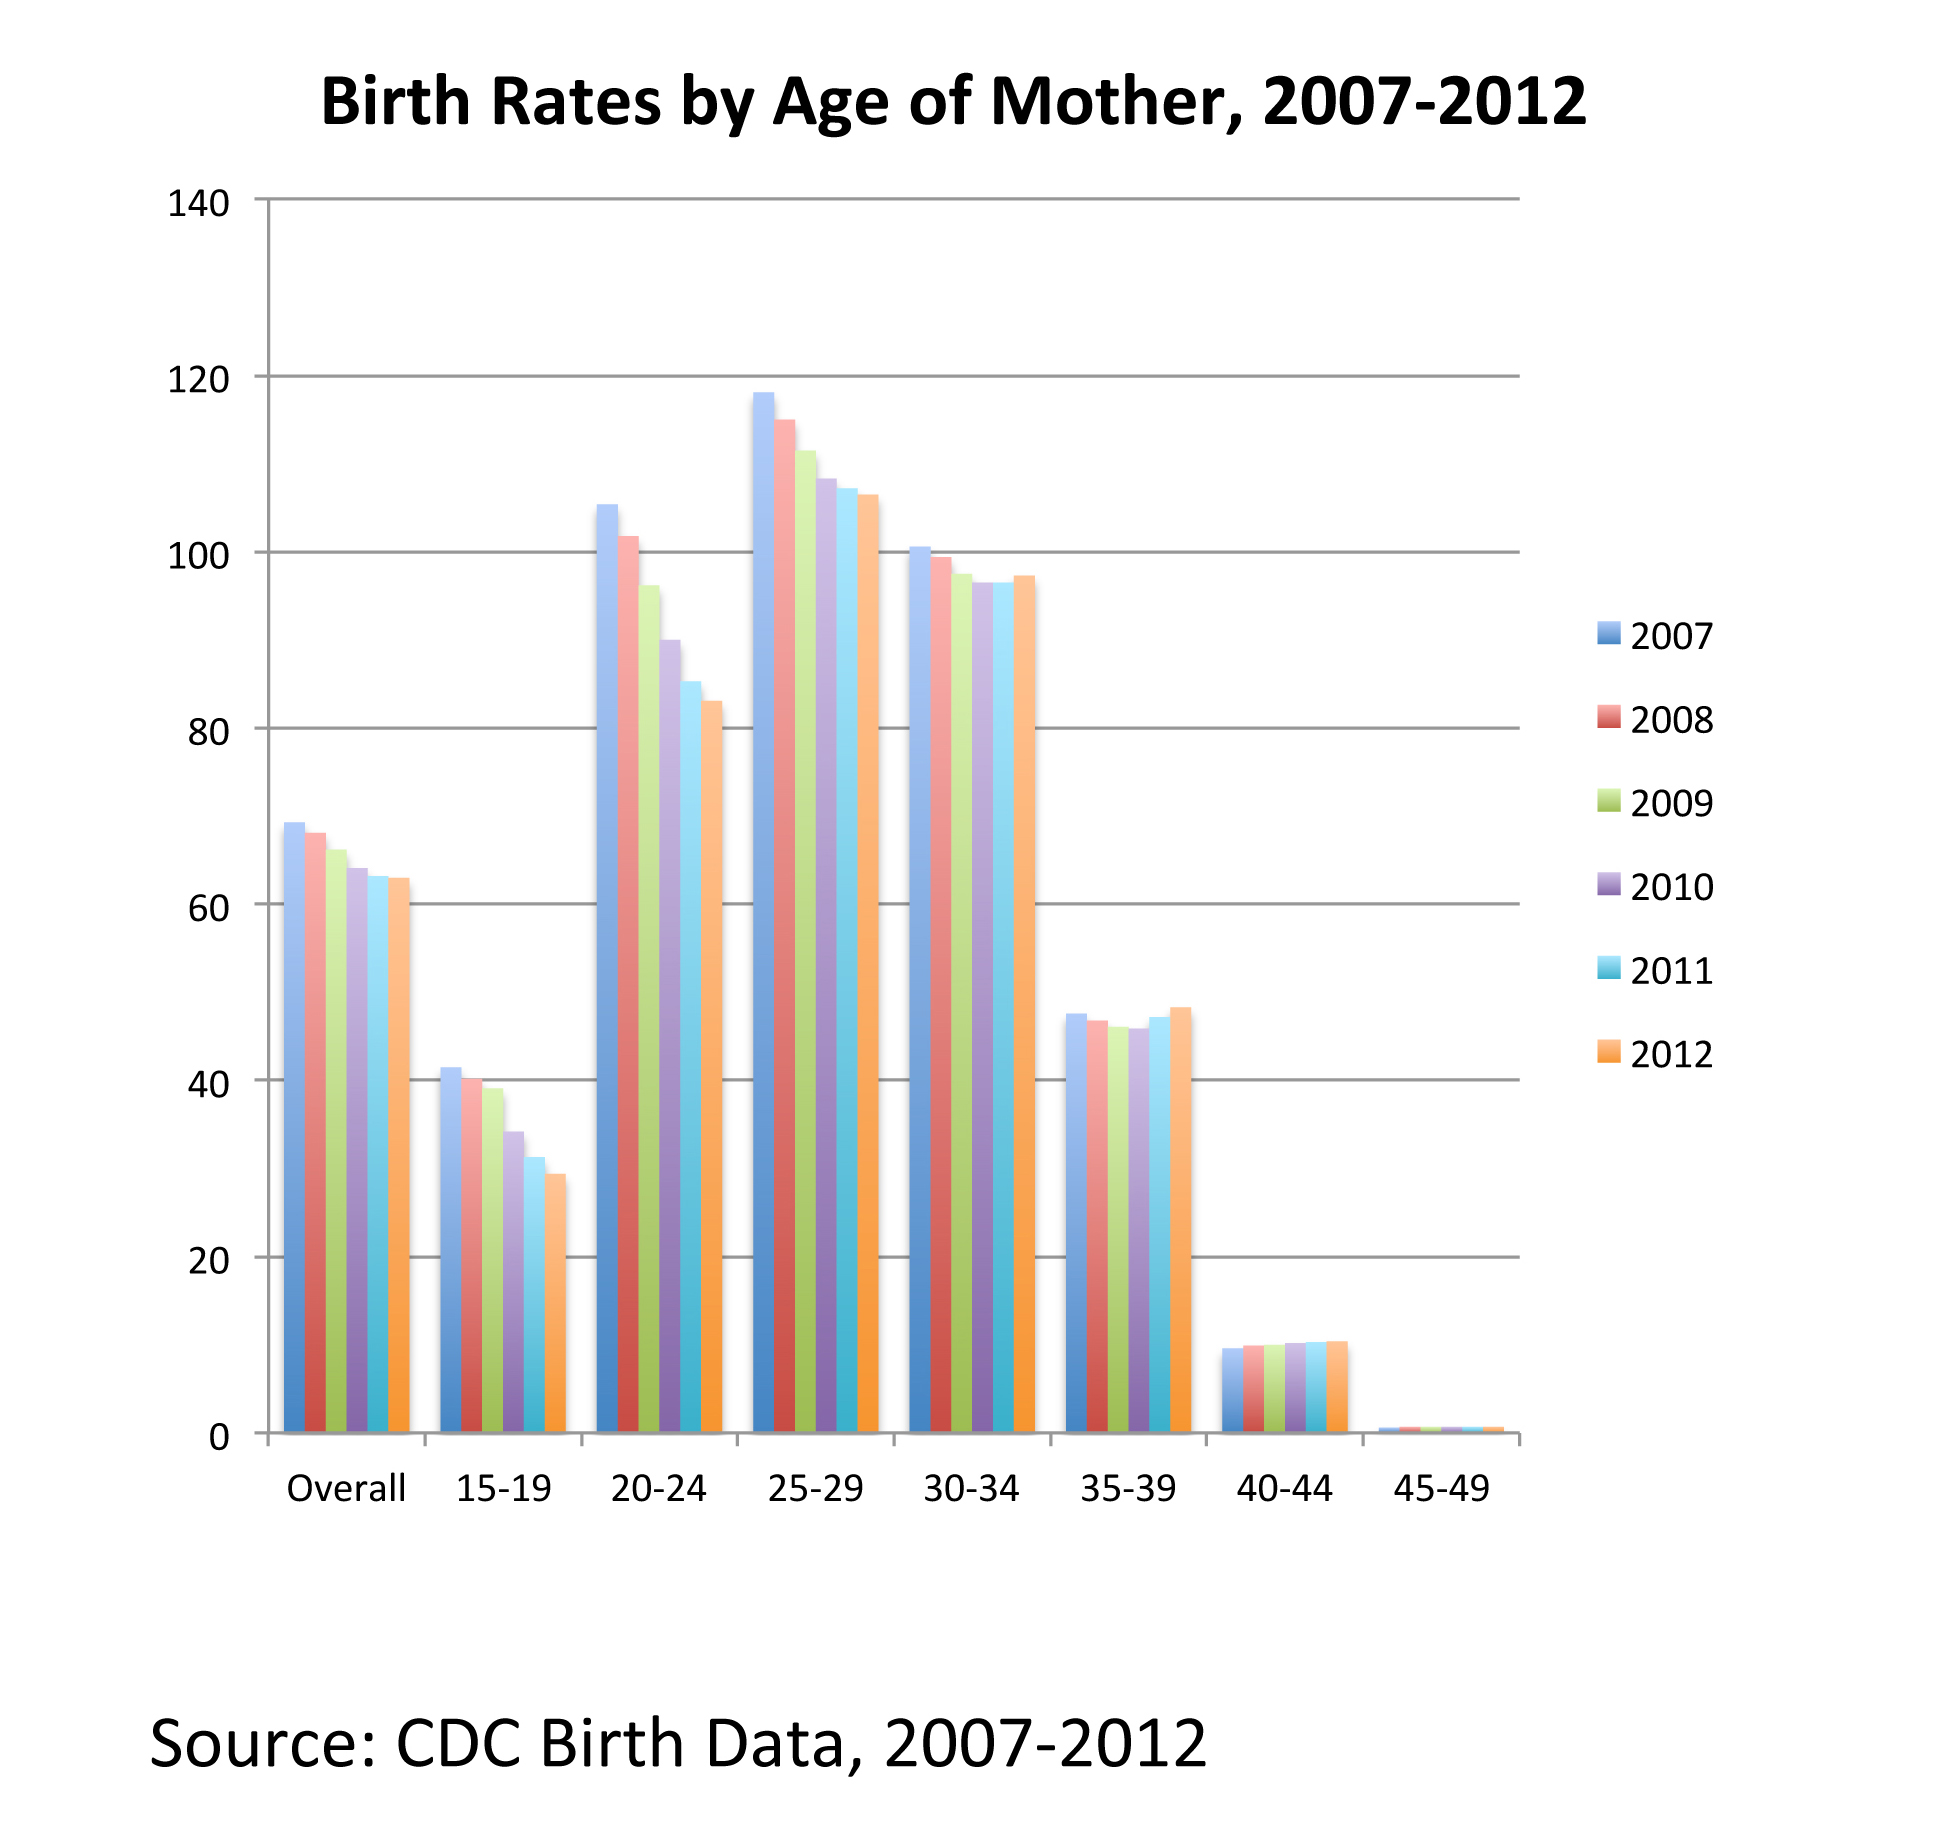
As you can see, the rates fell in all groups but those 40+ at the start of the recession, but have since begun to swing up again among women in their 30s.
Since 2007, the rate for women 15-19 fell 29%, the rate for women 20-24 fell 21%, for women 24-29 the rate fell 10%, for women 30-34 it fell 3.3%, including the 1% rise between 2011 and 2012. The rate for women 35-39 fell initially but rose in the past two years, for an overall gain since 2007 of 1.5%. The rate for women 40-44 never fell, and has risen 8.3% since 2007. Rates for women 45+ stayed steady.
The Total Fertility Rate (the total number of children the average woman would have at the current rate) fell to 1.88—a bit below the replacement rate of 2.1. But because the large part of the decline is among younger women, there is good reason to expect that rate to rise, if they follow the time-lag pattern of delayers before them, who’ve had children once they completed their educations and established in their careers. Provided, of course, that the economy continues to improve.
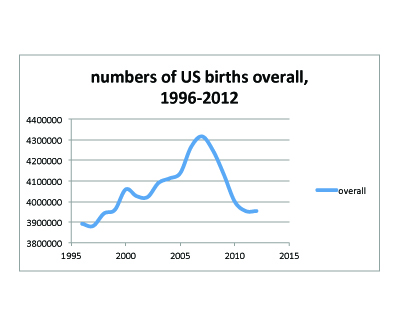
Here’s another chart, representing the actual birth numbers by age of mother, rather than birth rates, in lines rather than columns — since 1996.

Following up on the rate info above, the changes in the numbers of births by age of mother between 2007 and 2012 are as follows:
1-14 the numbers have fallen by 2,521 / 15-19 down by 139,479 births /20-24 down by 165,486 / 25-29 down by 84,398 / 30-34 up by 51,542 /35-39 down 27,708 / 40-44 up by 4,356.
Since different numbers of people appear in each age group each year, the number can go down even though the birth rate goes up (as with the 35-39 year olds), and vice versa (as with the 30-34 year olds). Likewise a group that starts with a fairly low number of births can have a big percentage rise, but show a low gain in actual numbers (as with the 40-44 year olds). When a group with big numbers has a big rate fall, you do see a big decline – so the total decline in births between 2007 and 2012 is 363,295 (there were that many fewer births in 2012 than in 2007, which was itself unusually high).