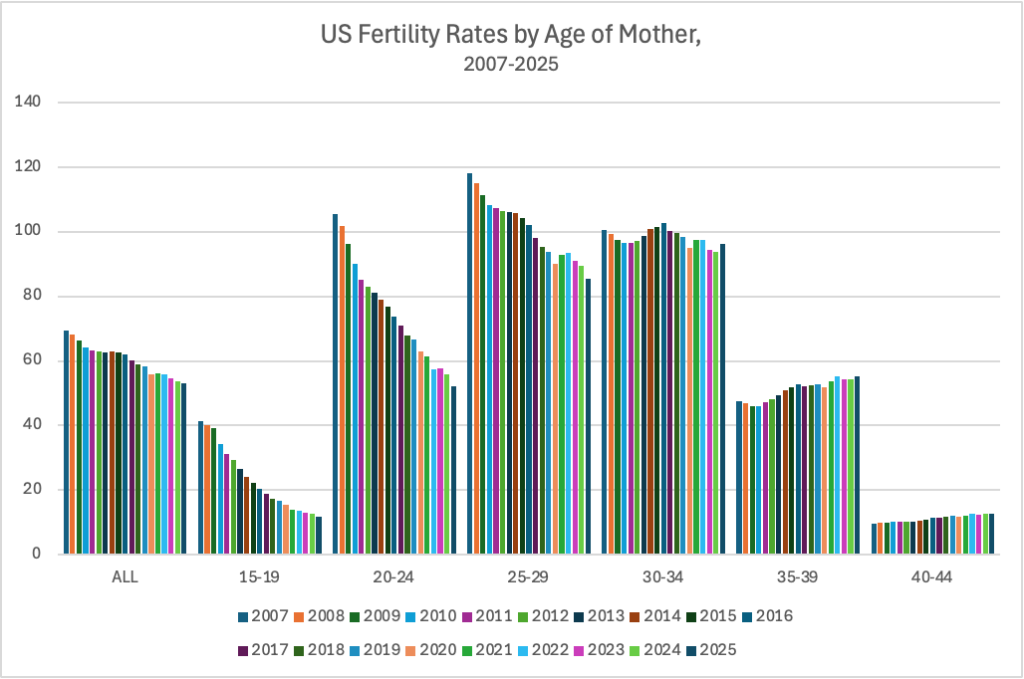
US fertility rates continued to fall overall in 2025 (down 1.3% for the second year in a row, for a total decline of 23.4% since 2007), to 53.1 births / 1,000 women between 15-44, from 53.8 in 2024.
That includes continued declines among women 15 through 29: rates for teens15-19 were down 7.1%between 2024 and 2025, to 11.7 births per thousand women in that age group (down 72% since 2007); rates were down6.5% among women 20-24 to 52.2 births (down 50.5% since 2007); and down 4.4% among those 25-29 to 85.6 births (down 27.5% since 2007).
Rates for women 30 through 44 rose, though less markedly than the younger group’s decline, while those for women 45-54 remained static. Rates for women 30-34 rose 2.6% in 2025 over 2024 (the first rise since 2021 in this age group, which has seen an overall fall of 4.4% since 2007); for those 35-39 rates rose 1.5% (up 15.7% since 2007, though up and down recently); while for those 40-44 rates rose 0.2% in 2025 over the year prior (up 33.3% since 2007, rising annually fairly consistently). Rates for women 45-54 held steady at 1.1 births per thousand women.
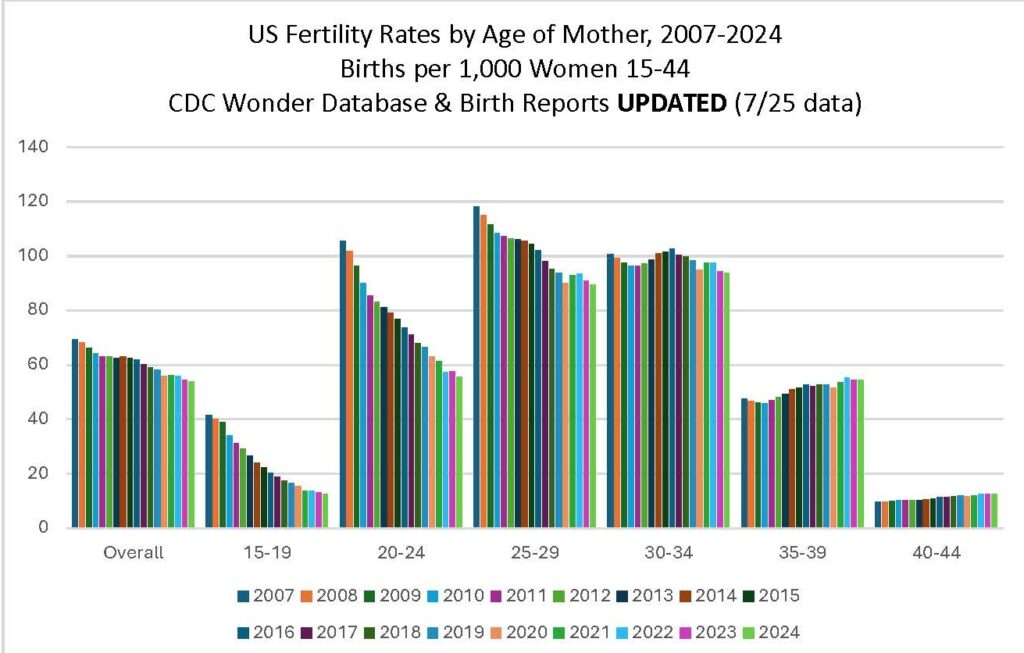
Per updated CDC data, the 2024 Provisional US Fertility Rate fell 1.3% overall (from 54.5 births / 1,000 women aged 15-44 to 53.8) from 2023. That included declines among teens 15-19 (down 4%, from 13.1 to 12.6 per 1,000 women in that age band); among women 20-24 (down 3%, from 57.7 to 55.8); among women 25-29 (down 2%, from 91 to 89.5), and among women 30-34 (down 1%, from 94.3 to 93.7). The fertility rate for women 35-39 as unchanged (at 54.3) while births among women 40-44 rose 2% (from 12.5 to 12.7 births /1,000).
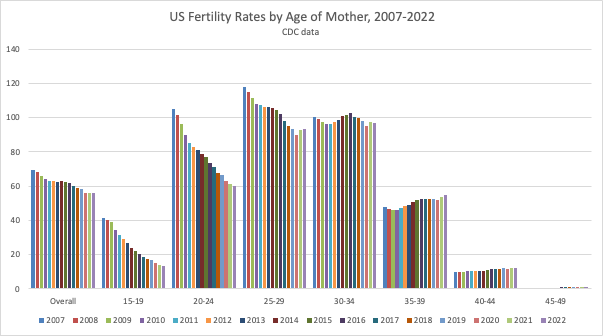
Chart 1 gives perspective on the ripple effect of the changes over time, whereby declining births among teens and women in their 20s since 2007 have to date led to some rate rises among older women (see prior posts for more on this topic). The large numbers of teens who are waiting a beat before starting families (that is, who delay first birth) have led to rising high school and college graduation rates, meaning that when and if they do have children later, they are better able to support them. In 2024, births declined in all age groups except the two highest. The pattern will be more clear once the data on first births becomes available for comparison later this year, so we can tell to what degree the 2024 births among older women are first births and/or additional births.
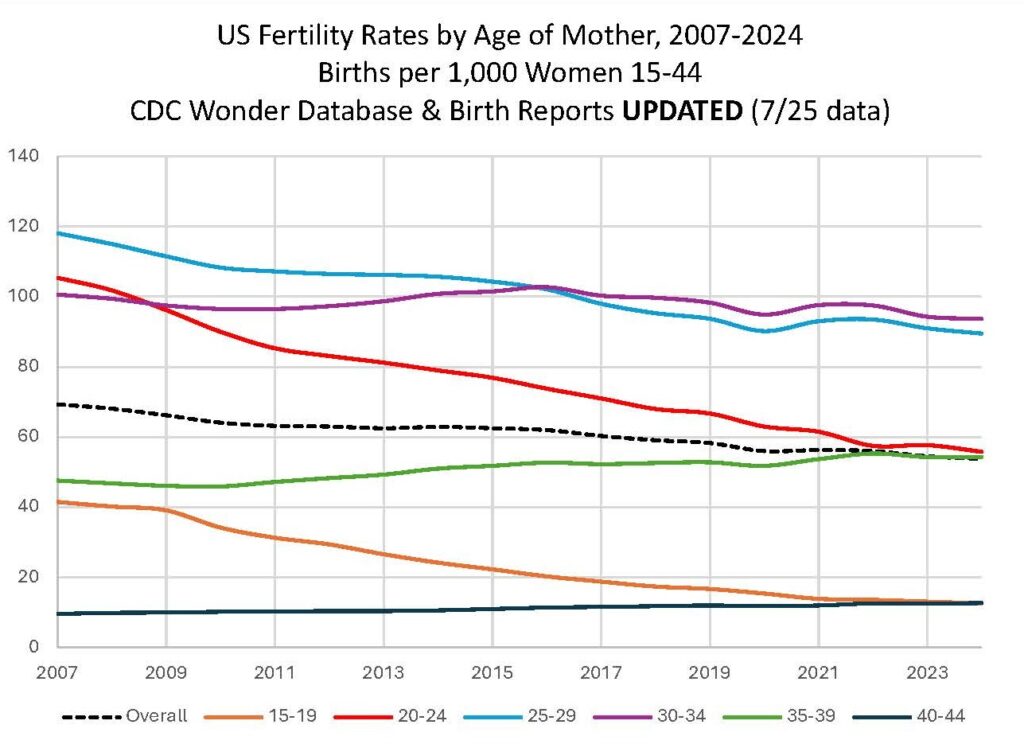
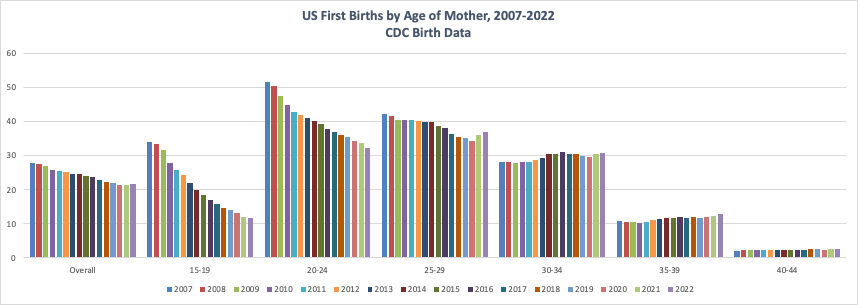
Chart 2 presents the same data linearly, making it visible that the teen rate has now fallen to slightly below that of women 40-44. Similarly, the fertility rate among women 30-34 rose to above that of women 25-29 in 2016, and has remained there, with parallel patterns of rise and fall over the years since. Likewise, the rates for women 35-39 and 20-24 came close to converging in 2024.
The Provisional Reports for 2024 birth data do not include breakouts of the data by state, race/ethnicity, or other factors, so it is not yet possible to compare effects across states or to see who is most affected by the rate changes within and across states. Final birth data for 2024 should be available in September or October 2025.
Close on the heels of the 2022 final birth data issued earlier this month, which showed national fertility rate declines but a notable rise in Texas–the only state at the time with births affected by an abortion ban, the CDC has just shared their provisional birth data for 2023.
This 2023 data set does not include fertility rates for units smaller than the nation, so state by state analysis will come later. The granular data will show the effects of abortion bans on the roughly one half of US states that now have some level of restriction, including variation across race/ethnicity and age.
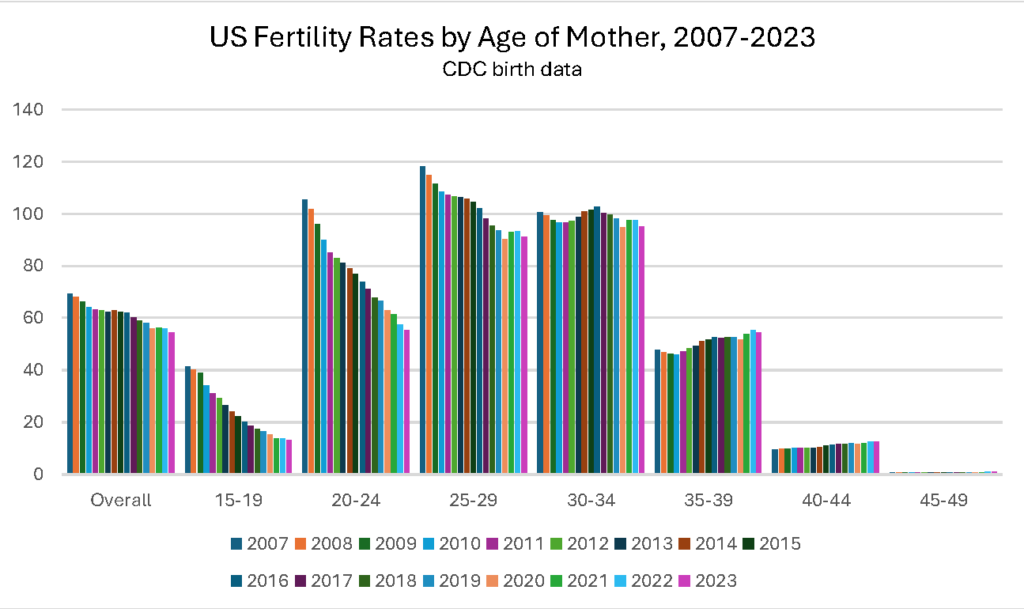
The national data show that, continuing the pattern of decline over the past 16 years, the overall US fertility rate fell to a new low in 2023, at 54.4 births per 1000 women aged 15-44, a fall of 2.9% from 2022. Teen births fell by 3% nationally, contributing to a 68.2% fall in the teen fertility rate since 2007. The fertility rate for women 20-24 fell 4% in 2023, with a 47.5% fall since 2007. The rate for women 25-29 fell 3%, for women 30-34 fell 2%, and the rate for women 35-39 fell 1%, while the rates for women 40-44 and 45-49 were unchanged. See chart below for overview.
Where rates for women 25-39 had been on an upswing over the past two years (suggesting a ripple effect of delay, as discussed in earlier posts), that pattern broke in 2023, with declines in all age groups 15-39 and stasis in the rates for women 40-49. Further data and analysis may clarify why some older women might be refraining from becoming pregnant, in a context where many states now refuse care to women with problematic pregnancies.
In 2022, per the CDC‘s newly issued final birth data report for that year, the overall fertility rate fell 1%, and the ripple effect pattern of delay evidenced in 2021 continued. Births among women under 25 continued to decline, while births among women 25 and over continued to rise (excepting rates for women 30-34, which remained essentially unchanged, falling 0.1%, after a 2.8% rise in 2021). Fertility rates for teens declined 2%, rates fell 7% for women aged 20–24, rose 1% for women 25–29, 3% for women 35-39, 5% for women 40–44, and rose 12% for women aged 45-49 (the first % increase since 2016).
2022 continued both a 19.2% overall fertility rate decline since 2007 (including slight rises in 2014 and 2021) and a 67.2% steady decline in births to teens 15-19 over the past 15 years – from 41.5 births per thousand women 15-19 down to 13.6. This radical change in teen births has created big workforce ripple effects (see my piece on the New Pronatalism, below ).
Among women having a first birth in 2022, the trends continued among women in all age sectors, with rates declining among women 24 and under and rising among women 25 and older.
The average age of motherat first birth rose to a new high of 27.4. The total fertility rate (the predicted total number of births / woman at current rates) declined to 1.65 births / woman. Fertility rates declined for unmarried women but increased for married women. The 2022 nonmarital fertility rate at 37.2 births/1,000 unmarried females aged 15-44 was 28% lower than the peak of 51.8 in 2007 and 2008 – and seems directly related to the fall in births to younger women. The fertility rate for married women increased 1% in 2022, to 84.2 per 1,000 married females aged 15-44.
Post-Abortion-BanEffects
Births in 2022 were unaffected by the Dobbs decision, since that was handed down in June 2022, and any sequent births due to lack of abortion access in ban states occurred in 2023 and after. The 2023 data will be out in the CDC’s provisional report later this year and in the final report likely in Spring 2025.
Data on 2022 births in Texas after the 6-week abortion ban that went into effect in 2021 are reported in UH IRWGS’s 2022 Texas Repro Health update.
TX & HC 2022 overall fertility rates rose, led by Hispanic women 25-44. Teen overall fertility rates rose for first time in 15 years, while national rate fell. Fertility rates and birth timing trends varied by race/ethnicity.
The 2022 overall fertility rate rose 2% in Texas and 2.9% in Harris County after Texas’s 2021 six-week abortion ban (see Figures 1 & 2), most markedly among Hispanic Women and specifically among Hispanic women 25-44 years old, who saw aggregated fertility rate rises of 8.0% and 8.5%, respectively, while rate changes for Non-Hispanic (NH) women 25-44 were much lower.
Texas and Harris County teen fertility rates (for women 15 to 19) rose for the first time in 15 years though the national fertility rate continued to fall. The effect on Texas teen fertility rates also differed by race/ ethnicity: while fertility rates rose among Hispanic, NH Black and NH Asian teens in 2022, they continued to fall among NH White teens.
Here’s a link to my recent piece in the Nation on policies restricting rights for women and LGBTQ people in the US and their common core: fertility control.